https://www.gosh.nhs.uk/conditions-and-treatments/clinical-outcomes/renal-dietetic-clinical-outcomes/
Renal dietetic clinical outcomes
Clinical outcomes are measurable changes in health, function or quality of life that result from our care. Constant review of our clinical outcomes establishes standards against which to continuously improve all aspects of our practice.
About the renal dietetic service
The Dietetic Department at Great Ormond Street Hospital for Children (GOSH) forms part of the Core Clinical Services Directorate. It is organised into clinical teams that each provide inpatient and outpatient services across many clinical specialties.
The Renal Unit at GOSH is the largest paediatric renal unit in the UK and one of the largest in Europe. The Renal Dietetic Service provides specialist paediatric renal dietetic support to children and young people and their families who are receiving treatment for kidney disease at GOSH.
Clinical outcome measures
The provision of safe, effective and quality care are key factors to excellent dietetic practice. Dietitians need to be able to identify and predict what the desired outcome of their intervention will be and then to what extent this is achieved. Measuring outcomes and sharing this information demonstrates the value of a dietetic service to the wider health community.
We aimed to assess whether dietetic input is effective in reducing raised blood potassium or phosphate in children with chronic kidney disease stages 3-5 and on dialysis (CKD3-5D). Reducing raised blood potassium and phosphate is important because high levels of potassium can be dangerous for the heart, including abnormal heart rhythms, and high levels of phosphate can affect the bones, growth and blood vessels.
Children and young people with CKD3-5D referred to a kidney dietitian at GOSH over a three-month period (July 2025 – September 2025) for advice related to a high blood phosphate or a high blood potassium were included. Routine test results (including potassium and phosphate levels) were recorded at the initial review and again at follow-up. For haemodialysis patients, pre-haemodialysis bloods taken after a two-day break from dialysis were recorded. Dietetic goals, facilitators (such as improving kidney function, dialysis, medication, correction of acidosis, gastrointestinal symptoms) and barriers (such as worsening kidney function, dialysis, medication, acidosis, gastrointestinal symptoms, compliance, social issues) were documented.
Some patients were referred to dietetics and reviewed (called episodes of care) multiple times within the data collection period. We had a total of 61 episodes of care included in this study. In 38 episodes of care, the aim was to reduce blood phosphate levels and in 23 episodes of care the aim was to reduce blood potassium levels. To be classified as having achieved the aim, the blood phosphate or potassium levels must have reduced below initial assessment levels. We also looked at the average change in the blood levels before and after dietetic intervention of those who achieved reduction in phosphate and potassium
1. Reduction in blood phosphate level
Chronic kidney disease mineral and bone disorder (CKD-MBD) involves blood and bone abnormalities, and calcium build up in the blood vessels, which can cause hardening. This can lead to bone pain and deformities, fractures, short stature and cardiovascular problems.
Prevention and treatment of CKD-MBD includes lowering blood phosphate by control of dietary phosphate intake and administration of phosphate binder medication. Patients referred to the kidney dietitians with a high blood phosphate were included in the data collection and analysis.
In 38 episodes of care, the aim was to reduce blood phosphate levels. Eighty-two percent (31/38) of the patients achieved a reduction in blood phosphate levels following dietetic education (Figure 1).
Sixty-one percent (19/31) who achieved a reduction had facilitators to aid the reduction. These facilitators included dialysis, phosphate binders, improvement in kidney function and transplantation. Thirty-nine percent (12/31) had a reduction in their phosphate levels due to dietetic intervention alone.
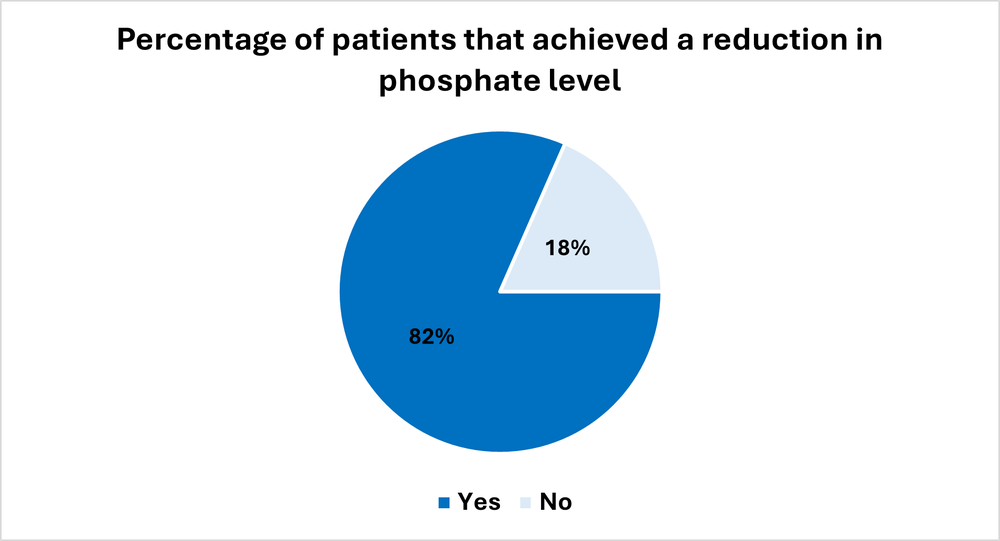
Figure 1. Percentage of patients that achieved a reduction in blood phosphate levels
Review of results for 2024 and 2025 showed comparable outcomes for both years (Table 1).
| Reduced phosphate level | 2024 | 2025 |
|---|---|---|
| Yes | 80% | 82% |
| No | 20% | 18% |
2. Reduction in blood potassium level
Potassium balance is disrupted in CKD and can result in hyperkalaemia (high potassium), which can cause life-threatening abnormal heart rhythms. Treatment of hyperkalaemia is guided by blood levels. Reduction in potassium intake alongside medical treatment is important to prevent hyperkalaemia.
Patients referred to the Renal Dietetics Team with a high blood potassium were included in the data collection and analysis.
In 23 episodes of care, the aim was to reduce blood potassium levels. Ninety-one percent (21/23) achieved a reduction in serum potassium levels following dietetic intervention (Figure 2).
Forty-three percent (9/21) who achieved a reduction had facilitators to aid the reduction. These facilitators included dialysis, correction of acidosis and potassium binders. Fifty-seven percent (12/21) had a reduction in their potassium levels due to dietetic intervention alone.
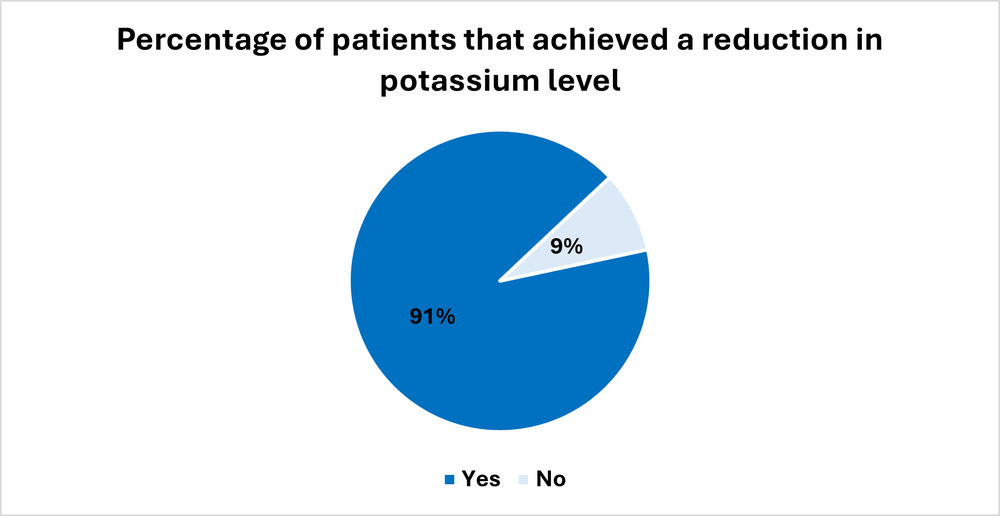
Figure 2. Percentage of patients that achieved a reduction in blood potassium levels
Review of results for 2024 and 2025 showed comparable outcomes for both years (Table 2).
| Reduced potassium level | 2024 | 2025 |
|---|---|---|
| Yes | 96% | 91% |
| No | 4% | 9% |
We looked at the percentage change in blood levels before and after dietetic intervention. There was a 21% reduction in potassium level and a 19% reduction in phosphate level (Figure 3).
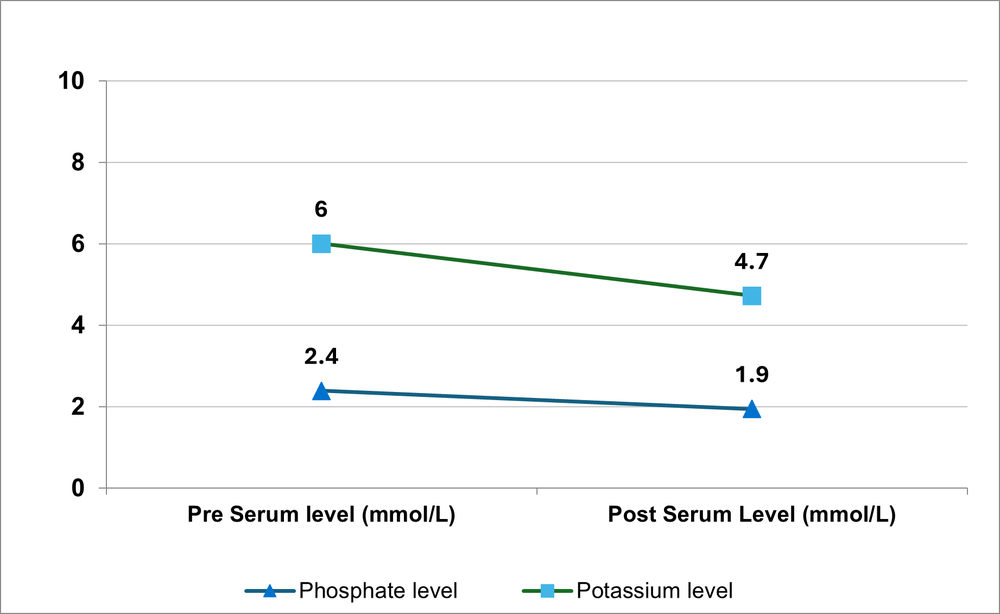
Figure 3. Average changes before and after for those who achieved reduction in phosphate and potassium
Service user survey
In addition to collection the outcome data above, we asked all parents/carers of the children referred to us to complete a short anonymous survey after receiving the dietetic advice. We asked the young people (12 years and older) to complete a different survey tailored for them.
We asked the parents/carers whether they: found the dietetic advice helpful, had enough support, were confident in understanding the diet, and what their challenges were. Seventy percent said the dietetic advice was very helpful and they were completely confident with understanding the diet (Figure 4). Most of them also felt they had enough support (Figure 5). Fifty percent of the parents said the biggest challenge was that their children will not eat the food that is being advised.
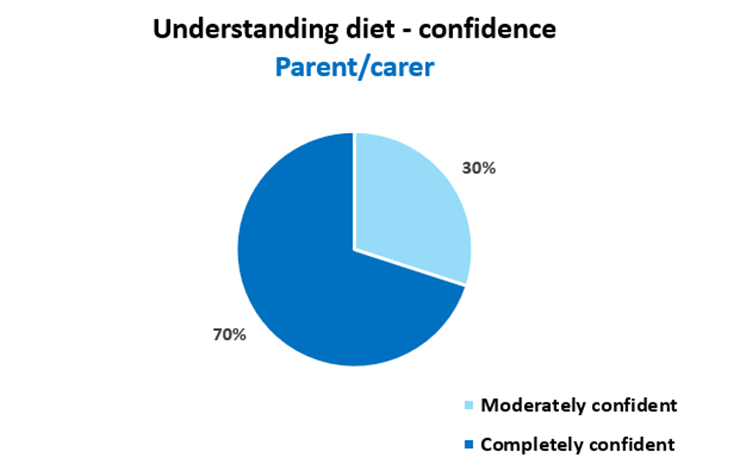
Figure 4. Parents/carer’s confidence in understanding the diet
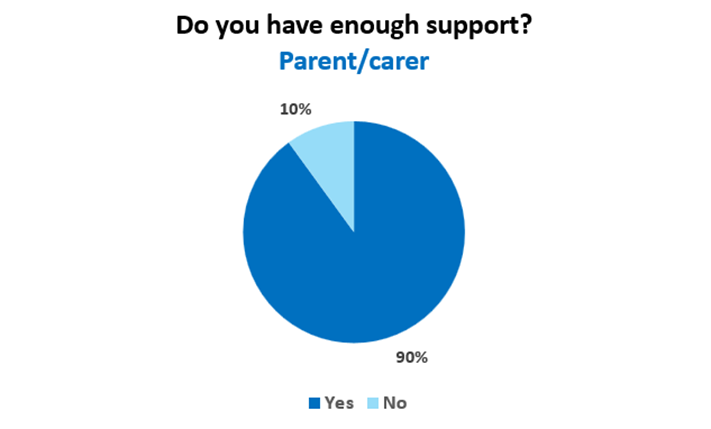
Figure 5. Dietetic support for parents/carers - survey results
We asked the young people how easy it was to understand the information given by the dietitian and how easy it was to make the dietary changes. We asked how the dietitian helped them to understand and what was difficult. Sixty percent said it was very easy to understand and the dietitian spoke clearly and used words they understood. However, only 40% of the children and young people found it easy to make the changes advised.
This survey supports the research by McAlister et al where it was shown that increased knowledge was not associated with decreased blood levels. There are other factors that contribute to following advice given. Dietitians need to understand the families’ needs and priorities, help identify barriers to adherence, support them through challenges, identify what motivates the children and young people, and provide practical advice and resources.
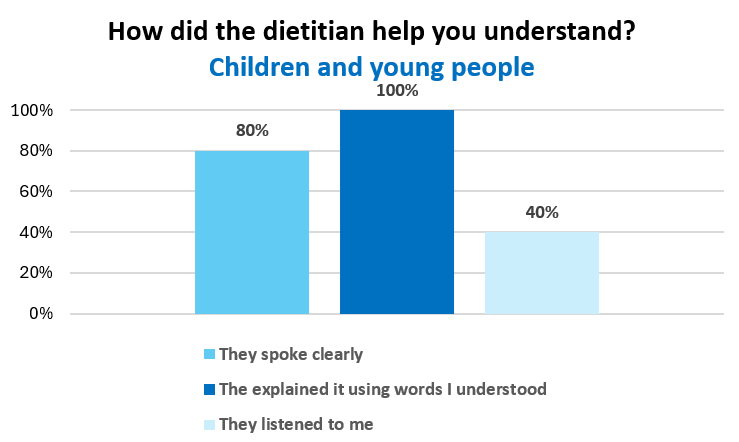
Figure 6. Children and young people responses on how the dietitian helped them to understand
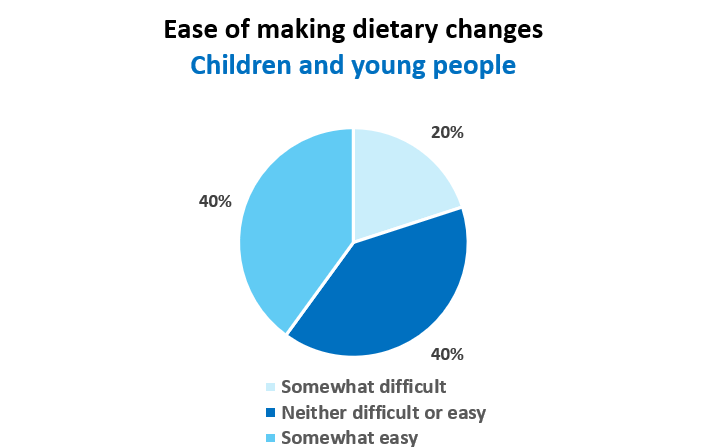
Figure 7. Children and young people responses on ease of making dietary changes following advice
References
McAlister, L., Shaw, V., Pugh, P., Joyce, T., Snauwaert, E., Bathgate, F., Holt, C., Anderson, C., Desloovere, A., Renken‑Terhaerdt, J., Grassi, M. R., Bakkaloğlu, S., Sahin, G., Shroff, R., & Lambert, K. (2025). Barriers to and facilitators of phosphate control in children with chronic kidney disease. Kidney International Reports, 10(12), 4252–4263. https://doi.org/10.1016/j.ekir.2025.09.045
British Dietetic Association (2021) BDA Model and Process for Nutrition and Dietetic Practice. Available at: https://www.bda.uk.com/static/376a7558-80cb-46f8-bd8712d9725f590a/2021-BDA-Model-and-Process-for-Nutrition-and-Dietetic-Practice.pdf
Gardiner, C., El-Sherbini, N., Perry, S., Alderdice, J., Harman, A. and Tarm, L. (2019) 'The Renal Dietetic Outcome Tool (RDOT) in clinical practice', Journal of Kidney Care, 4(3), pp. 116–124. doi: 10.12968/jokc.2019.4.3.116